

PlantGrid.

An ICT operations desk for a fictional plant — cases, assets, maps, messages, and an assistant that answers from the same live demo register.
PlantGrid
An ICT operations desk for a fictional plant — cases, assets, maps, messages, and an assistant that answers from the same live demo register
Open the live demoMost portfolio dashboards are galleries of charts that never have to survive a shift. PlantGrid is the opposite bet. I wanted a manufacturing technology console that feels like an ICT desk: open work, overdue maintenance, a printer that just failed on the packaging line, a security case still mid-investigation, and a map that shows where the device actually sits. The plant is fictional. The workflows are not.
The demo lives at Northridge Processing. Sign in as Amina Okello (System Administrator) or switch into an ICT manager, technician, department lead, employee, or auditor. Permissions change what the console will let you do. Monitoring samples and backup runs are simulated and labelled as such. Nothing here controls real machinery. The screenshots below are from the live demo UI.
The Idea in One Sentence
PlantGrid keeps inventory, support work, and infrastructure records in one place so a shift can move from an open case to the asset, the hall, the switch, and the maintenance note without leaving the console.
I built it to prove six things I care about in product work:
- An operations product can stay clear without drowning the first screen in widgets.
- Cases need a lifecycle people can see — New, Assigned, In Progress, Pending, Resolved, Closed.
- Assets are not rows; they are devices with photos, specs, locations, and linked tickets.
- A plant map turns abstract tags into places a technician can walk to.
- Role-aware access matters: CEO, admin, ICT, production, and audit should not see the same buttons.
- Assistance should wait for confirmation, refine notes, and answer from the same demo register — not invent a second source of truth.
The First Screen: Work Before Decoration
Amina’s dashboard opens with a greeting, the date, and two primary moves: open cases or raise a new one. Under that sit KPI cards for ICT assets, maintenance load, open tickets, and critical incidents. A red alert strip is honest about itself: critical readings are simulated and are not from live plant equipment. Upcoming work and recent cases sit where an operator’s eyes naturally go after the numbers.
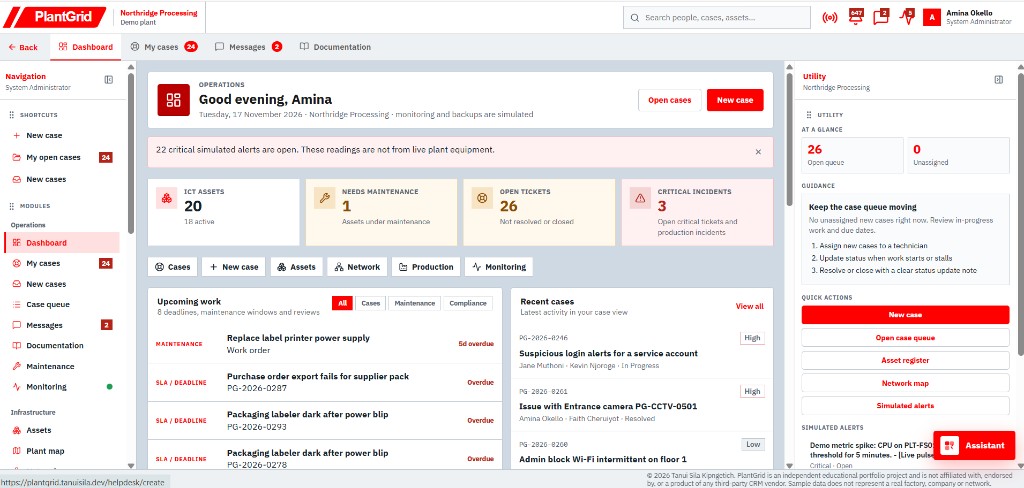
The right rail stays practical: open queue count, a short guidance checklist (assign, update, resolve), and quick actions into the queue, asset register, network map, and simulated alerts. The header carries search across people, cases, and assets, plus notification badges for alerts, messages, and health pulse — the ops layer of the shift, not a marketing strip.

"If the first screen cannot tell you what is overdue, who owns it, and what to click next, it is a wallpaper with metrics."
Cases: The Queue Is the Product
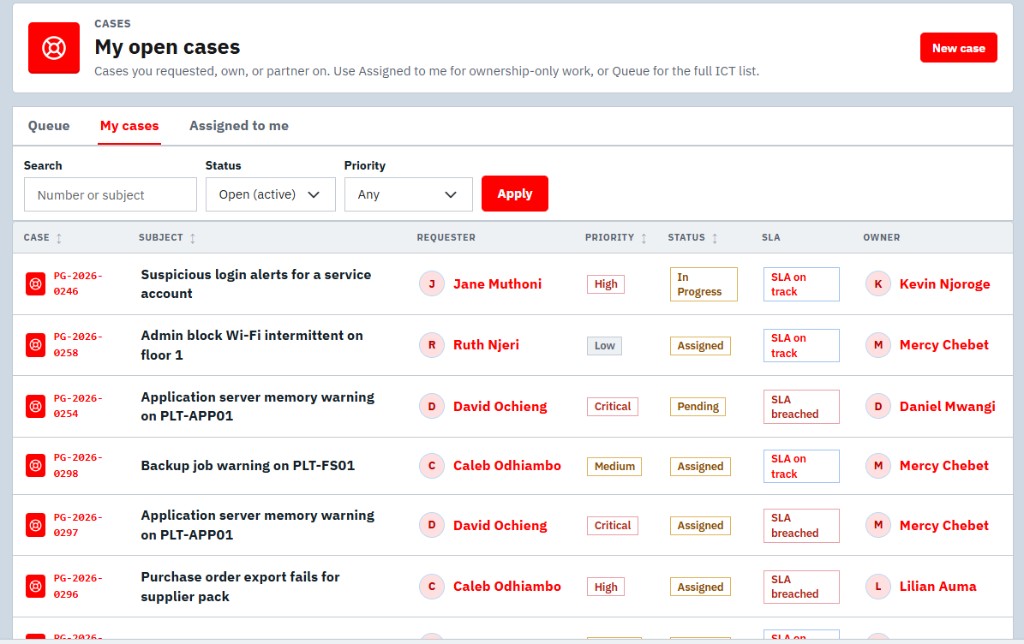
PlantGrid treats cases as first-class work, not as a side panel. My open cases filters to work you requested, own, or partner on. Queue views cover the wider ICT list. Each row carries case number, subject, requester, priority chip, status, SLA state, and owner. SLA breached rows are loud on purpose. Priority chips (Critical, High, Medium, Low) are readable at a glance without turning the table into a rainbow.
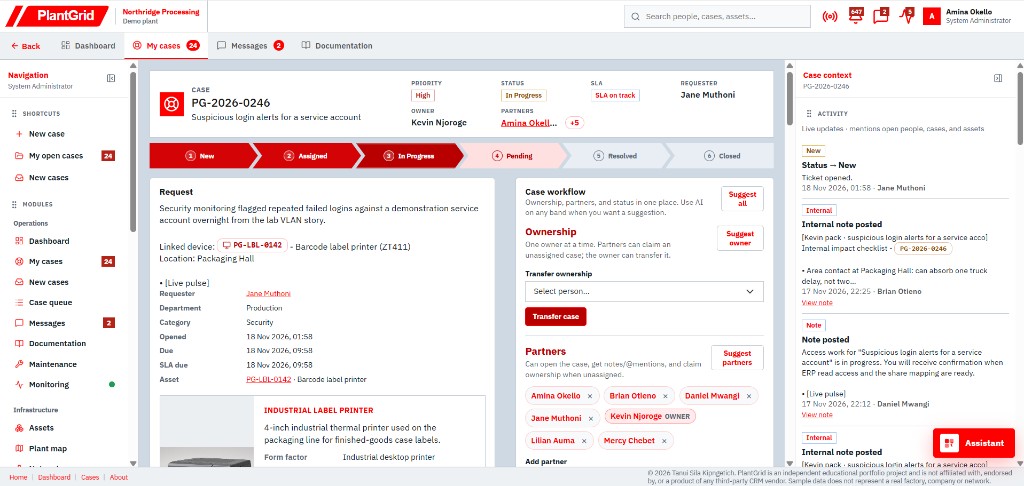
Open a case such as PG-2026-0246 — suspicious login alerts for a service account — and the story widens. A chevron stepper shows where the ticket sits in the lifecycle. Request details name department, category, due times, and the technical summary. The linked industrial label printer appears with a photo and location in Packaging Hall. Partners can be suggested or transferred. Case context on the right keeps activity, internal notes, and timestamps in one feed.
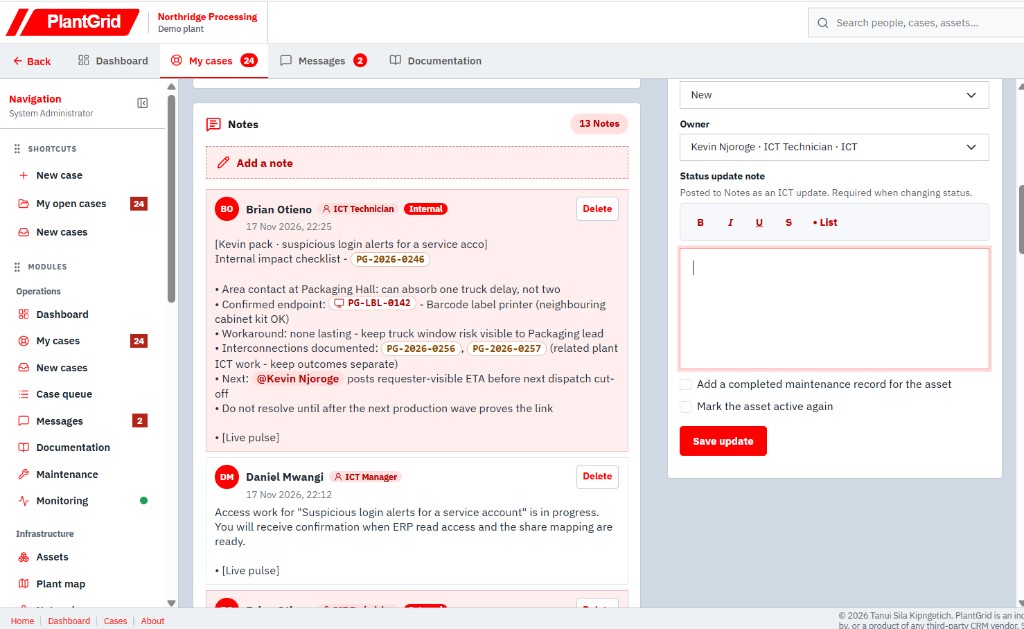
Updates are where the shift actually happens. Notes carry internal checklists, @mentions, linked case IDs, and ETAs. The status panel lets you change owner, write a status update note, optionally record completed maintenance on the asset, and mark the asset active again — one save, one coherent handoff.
Assets: The Device Behind the Ticket
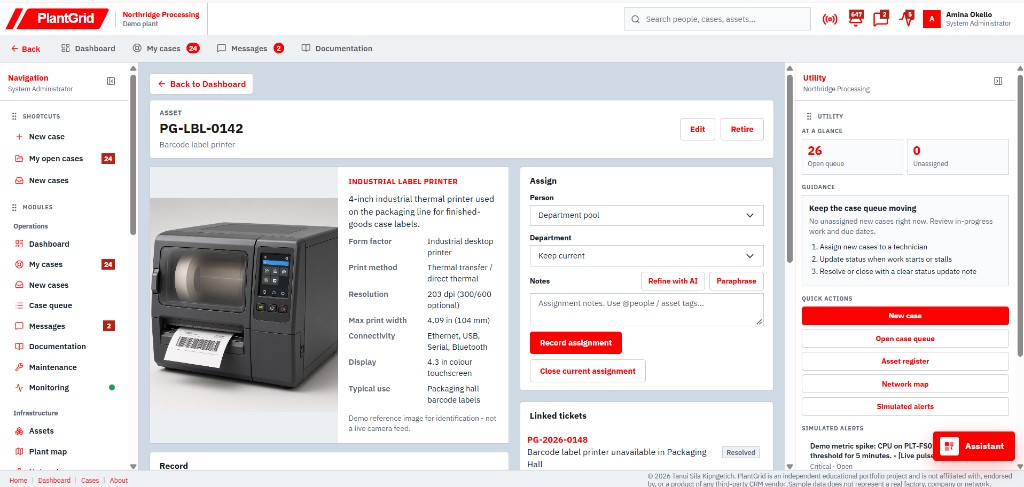
A ticket about a label printer is unfinished until you can see the printer. Asset PG-LBL-0142 shows a product photo, form factor, print method, resolution, connectivity, and display. Assignment can go to a person or a department pool. Notes can be refined or paraphrased with AI before you commit. Linked tickets sit underneath so history is not buried in another module.
Plant Map: Walk the Hall, Not Just the Tag
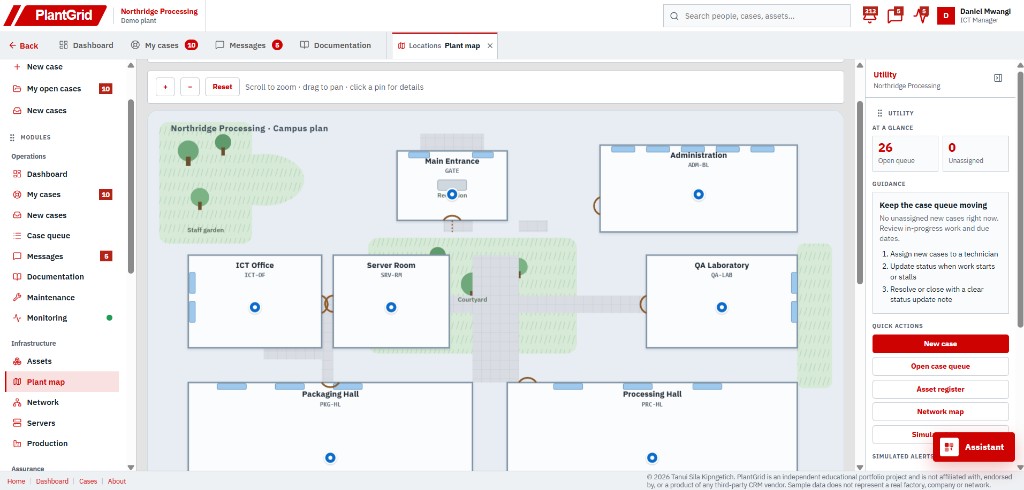
Tags like PKG-HL and SRV-RM only become useful when they map to space. The campus plan for Northridge Processing shows Main Entrance, Administration, ICT Office, Server Room, QA Laboratory, Packaging Hall, Processing Hall, courtyard, and staff garden. Pins mark active points. Zoom, pan, and click for details. The point is orientation: when Packaging needs a hot-spare printer before 13:30, you already know which hall that means.
"A case number without a hall is a spreadsheet. A hall without a case is a tour. PlantGrid insists on both."
Messages and the Assistant
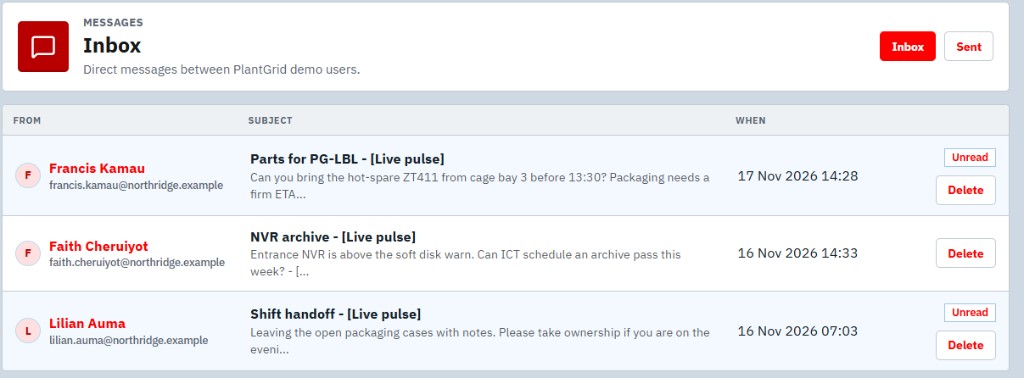
Shift handoffs do not only live inside tickets. The inbox carries direct messages between demo users: a hot-spare printer request for Packaging, an NVR archive warning, a handoff note for evening coverage. Unread and delete actions stay on the row. It is deliberately small — enough to show human coordination beside the formal queue.
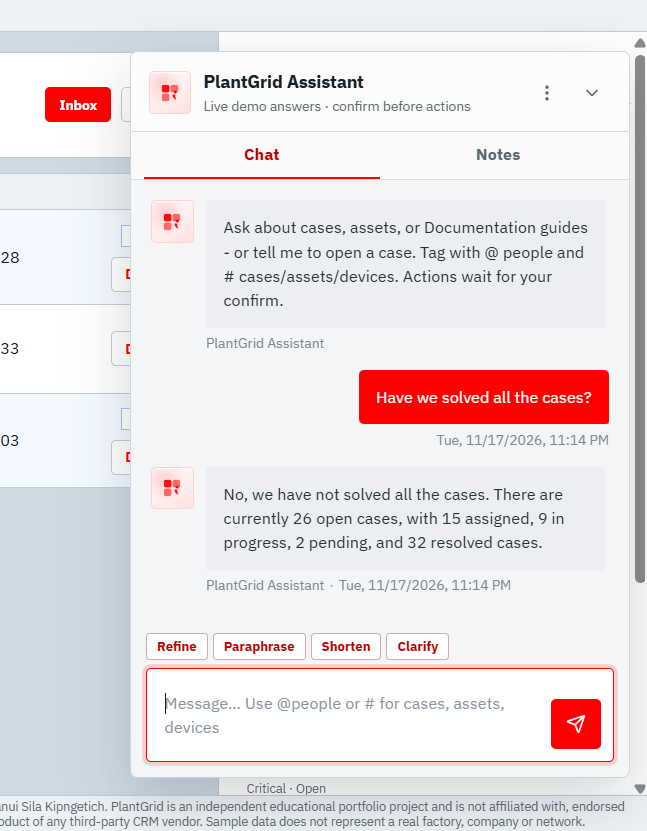
The PlantGrid Assistant sits on top of the same register. Ask whether all cases are solved and it answers with open, assigned, in-progress, pending, and resolved counts from the demo data. You can tag people and cases. Prompt helpers (Refine, Paraphrase, Shorten, Clarify) sit above the composer. Actions wait for confirm. The subtitle says the quiet rule out loud: live demo answers, confirm before actions.
Documentation for Novices, Charts for Managers
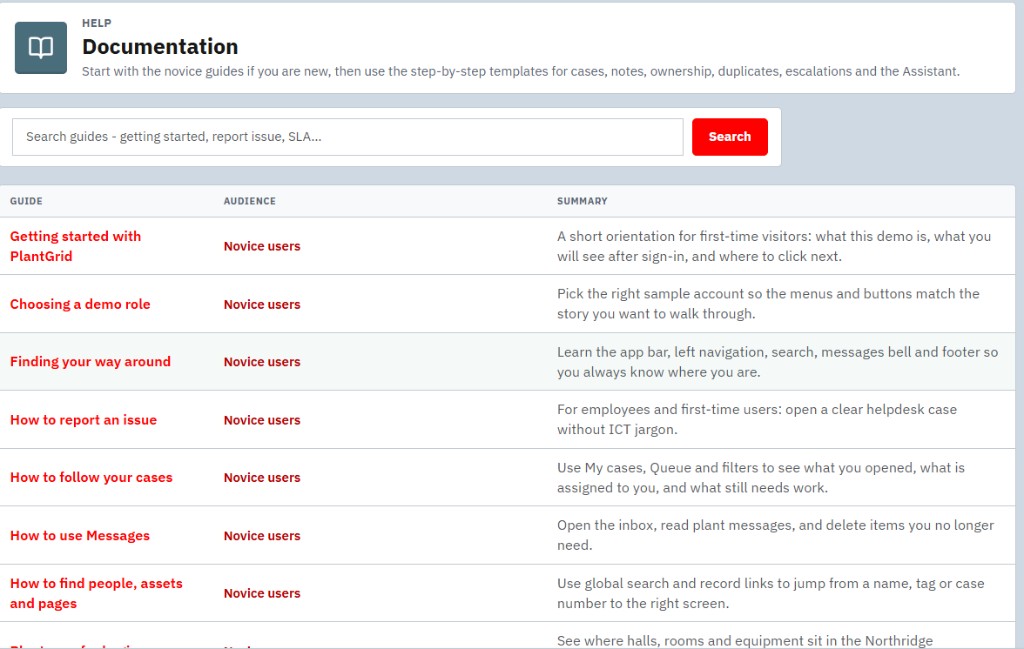
A console this dense needs an on-ramp. Documentation is a searchable guide table aimed at novice users: getting started, choosing a demo role, finding your way around, reporting an issue without ICT jargon, following cases, using messages, and searching people or assets. The audience column stays honest — these are orientation guides, not buried admin manuals.
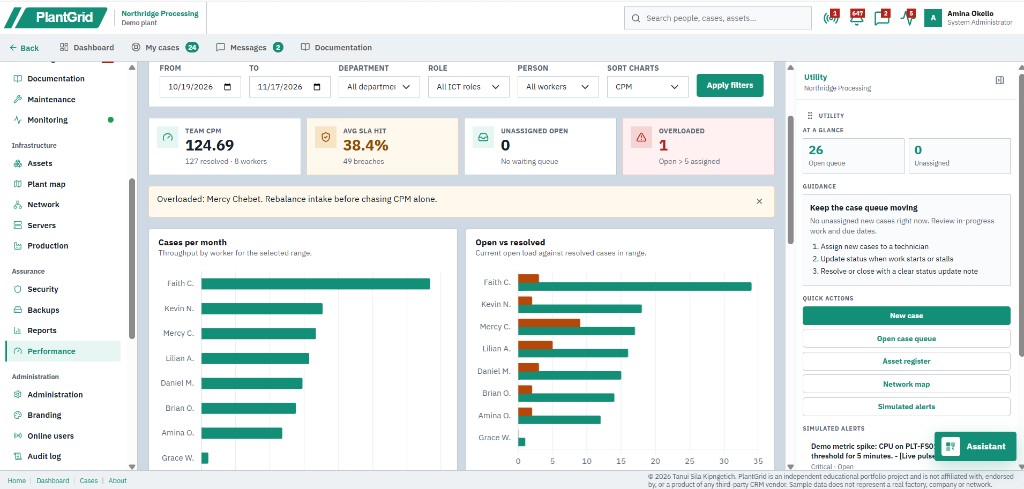
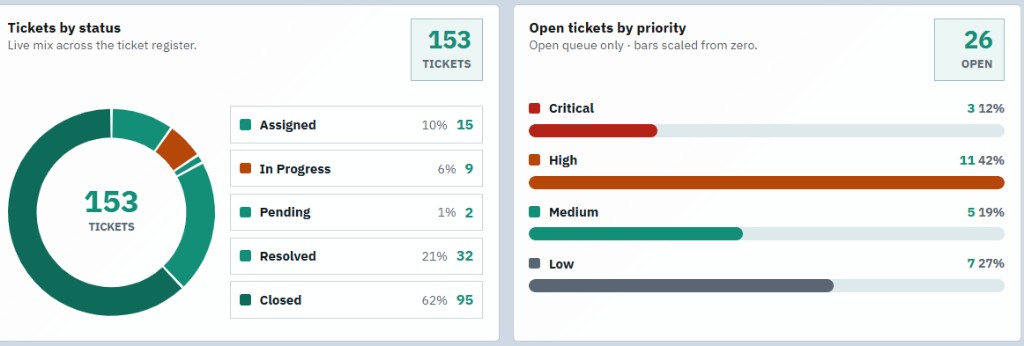
Performance views speak to managers. Team CPM, average SLA hit, unassigned open, and overloaded workers sit above charts for cases per month and open versus resolved. An overload banner names the person before anyone chases throughput alone. Ticket-mix charts split the full register by status and the open queue by priority — inventory versus human work, side by side.
Personalization Without Breaking Readability
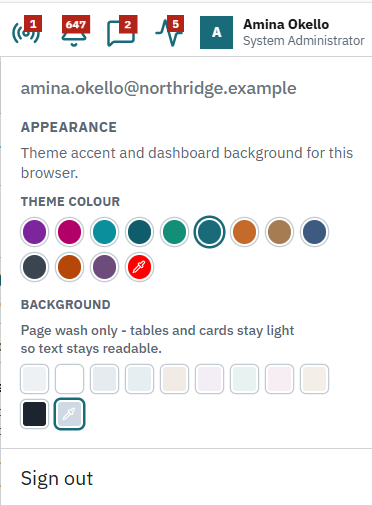
Operators live in this console for hours. Theme colour and background wash are per-browser choices. Accents can shift; page washes stay light enough that tables and cards remain readable. Dark mode exists as an option, not as the default personality of the product. Sign-out stays one click away at the bottom of the menu.
A Walkthrough I Use When Showing the Demo
- Sign in as System Administrator (amina.okello@northridge.example). Demo password is shared across accounts on the sign-in page.
- Read the dashboard KPI strip and the simulated-alert banner. Notice what is overdue before opening anything fancy.
- Open My cases, then a high-priority security or packaging ticket. Follow the lifecycle stepper.
- Jump to the linked asset. Confirm location, specs, and assignment controls.
- Open Plant map and find Packaging Hall / Server Room so the tags become space.
- Check Messages for a live handoff, then ask the Assistant a factual question about open cases.
- Switch roles if you want to see how permissions shrink or widen the console.
What I Left Out on Purpose
There is no claim that this is a commercial CRM or a SCADA system. Monitoring is simulated and labelled. Backups are demonstration runs. The plant, people, and alerts are fictional. I left out end-to-end control of real equipment because the portfolio goal is operations product craft — clear records, role-aware access, and workflows that match how ICT teams move work — not pretending to run a factory from a browser tab.
I also left out a noisy marketing homepage inside the signed-in console. Once you are in, the product should feel like a desk: navigation, search, queue, map, assistant. The public landing page can sell the story; the dashboard has to survive a shift.
PlantGrid is an independent educational portfolio project by Tanui Kipngetich Sila. It is not affiliated with, endorsed by, or a product of any third-party CRM vendor. Sample data does not represent a real factory, company, or network. What it does represent is how I think about systems, interface, and ICT operations design when the work has to stay readable under pressure.
Start as System Administrator, open a packaging or security case, follow the linked asset to the plant map, then ask the Assistant what is still open. If you are building in technology, manufacturing systems, or ICT operations, I welcome a conversation.
Leave a comment
Email stays private. Name and email are optional.