

Admin Cockpit

How I track visitors, posts, and inbox noise from one admin dashboard — with maps, adaptive legends, and charts that match how I edit.
Admin Cockpit
How I track visitors, essays, project launches, and inbox noise without turning the portfolio into a second full-time job
Visit the public siteA portfolio is only half finished when the public pages look good. The other half is the quiet machinery behind them: who arrived, which essay they stayed with, which project card they actually launched, which country the traffic came from, and which human reply still needs my name on it. I built an admin cockpit for this site so those answers live in one place, with charts I can read in under a minute and tables I can act on without opening a spreadsheet.
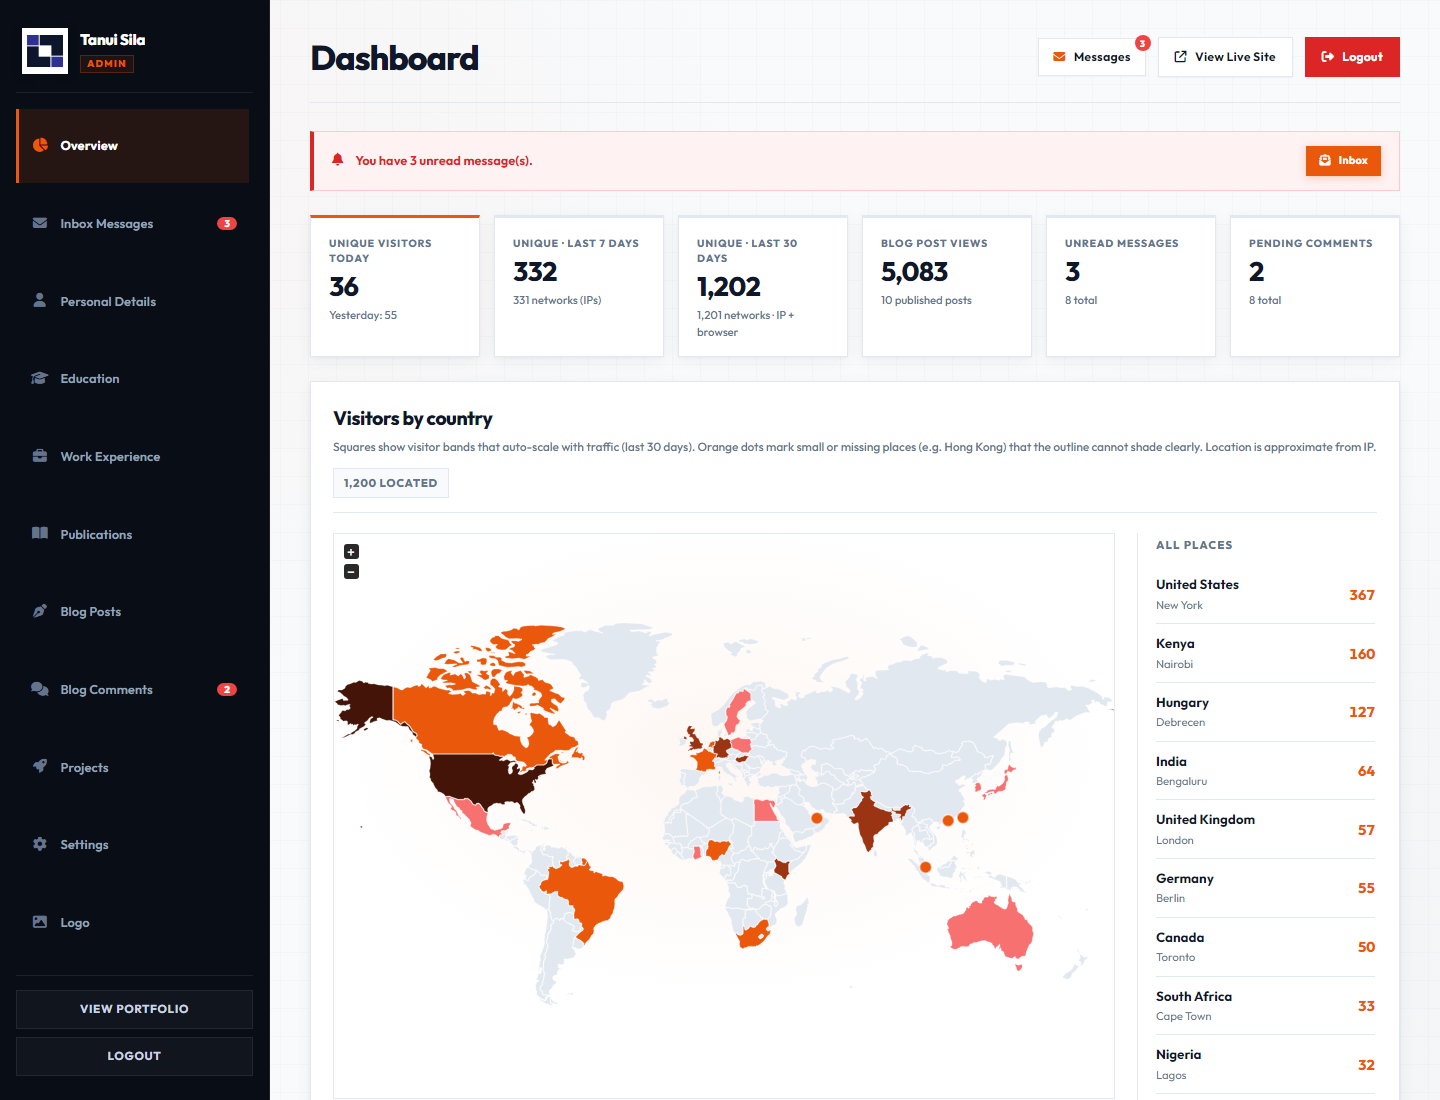
This post is a walkthrough of that cockpit. It is not a SaaS pitch. It is a record of how I manage my own portfolio day to day: unique visitors that do not double-count the same browser, a world map that still shows Hong Kong, project interest that separates a glance from a launch, pie charts that do not spill titles across the card, and an ops list for comments and mail. The screenshots below are from the live admin UI on local data shaped like real traffic.
The Problem I Wanted to Solve
Early versions of this site were editable, but not operable. I could publish a post or ship a project demo, then I had no calm way to see whether anyone read the essay, whether a campus Wi‑Fi lab looked like one visitor or forty, whether “Launch live” was getting clicked, or whether a kind comment was sitting in moderation while I answered email elsewhere.
I wanted a single dashboard that answered six questions without ceremony:
- How many distinct people showed up today, this week, and this month?
- Where, roughly, are those people coming from?
- Which posts are carrying the attention?
- Which projects are being seen, and which ones are actually launched?
- Is the portfolio inventory (blog, projects, education, experience, publications) still balanced?
- What human work is waiting: unread messages and pending comments?
If the cockpit cannot answer those, it is decoration. If it can, it becomes part of how I ship.
The First Screen: Numbers Before Narrative
The top of the dashboard is a KPI strip. Unique visitors for today sit next to the seven-day and thirty-day windows. Blog views, unread messages, and pending comments sit beside them. The strip is intentionally boring. Boring is the point. I should be able to glance once and know whether the day is quiet, whether the inbox needs me, and whether moderation is stacking up.

Uniqueness is the hard part hiding under those large numbers. Cookie-only counting inflates when people clear storage or open private windows. IP-only counting collapses a whole campus lab into one person. The compromise I use is a daily hash of IP plus browser family: Chrome on shared Wi‑Fi and Firefox on the same Wi‑Fi can count as two; the same Chrome profile opening incognito does not invent a second person for that day. The meta line under the thirty-day card also shows distinct networks, so I can see when many hashes still share a small set of IPs.
"A dashboard that cannot explain uniqueness is just a vanity counter with better fonts."
Visitors by Country: A Map That Stays Honest
Geography is approximate. An IP is not a passport. Still, a choropleth answers a useful editorial question: is attention local to Kenya and Hungary, or is a post travelling farther than I expected? The map panel shades countries by unique visitors over the last thirty days. Darker means more. The side list shows every located place, not only a vanity top five, because a single visitor from a new country is still a signal worth noticing.
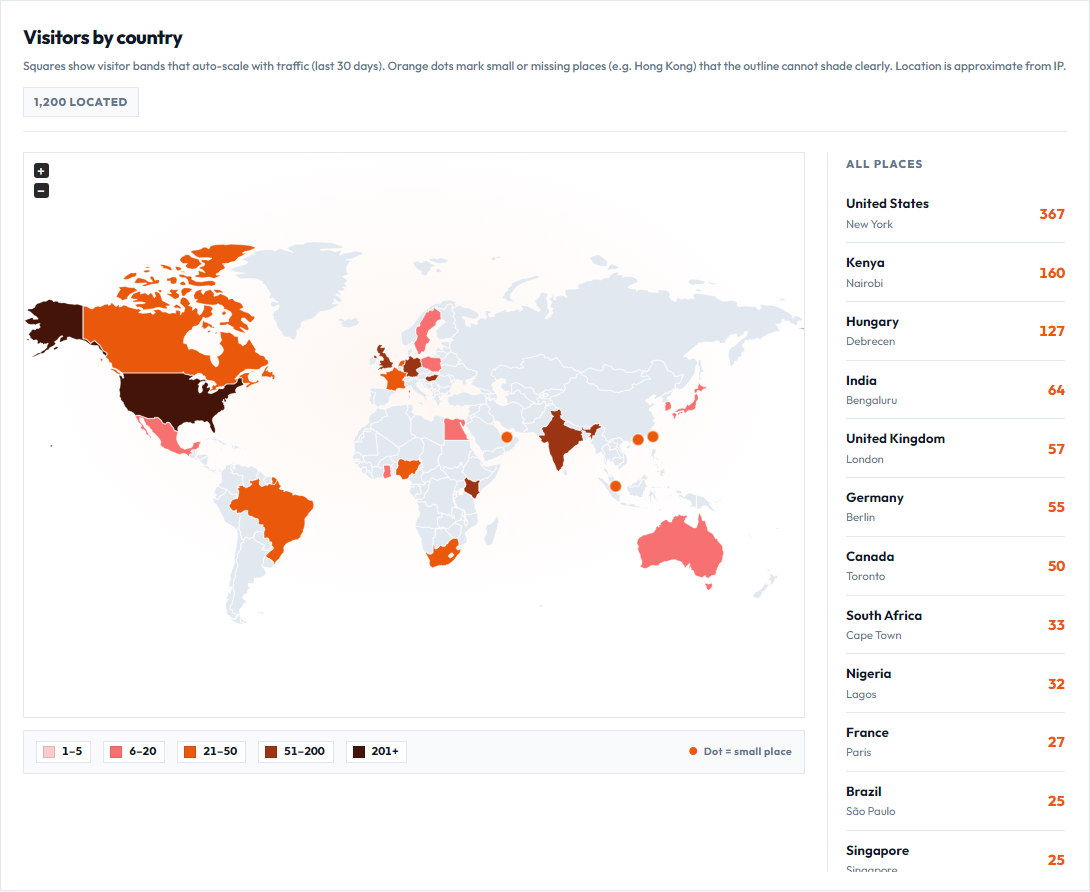
Two map problems showed up immediately and both were design problems disguised as data problems.
First, small places. Hong Kong and Singapore are often missing from the world outline entirely. A shade cannot appear on a shape that is not drawn. When those places have visits, the cockpit drops an orange pin on their coordinates and keeps them in the country list. The map stays a map; the pin is the honesty layer.
Second, legends that lie by omission. A continuous “Fewer → More” bar looks elegant and then fails the moment the top country turns near-black while the legend only shows pale pink and orange. The fix was discrete squared bands that always span the full light-to-dark palette. The top band uses the darkest swatch, and each country is painted with that exact hex. The bands rebuild from the data: early traffic might read 1, 2, 3; later traffic might read 1–9, 10–49, 50–199, 200+. Compact k and M labels keep the chips readable when the numbers explode.
Charts That Match How I Edit
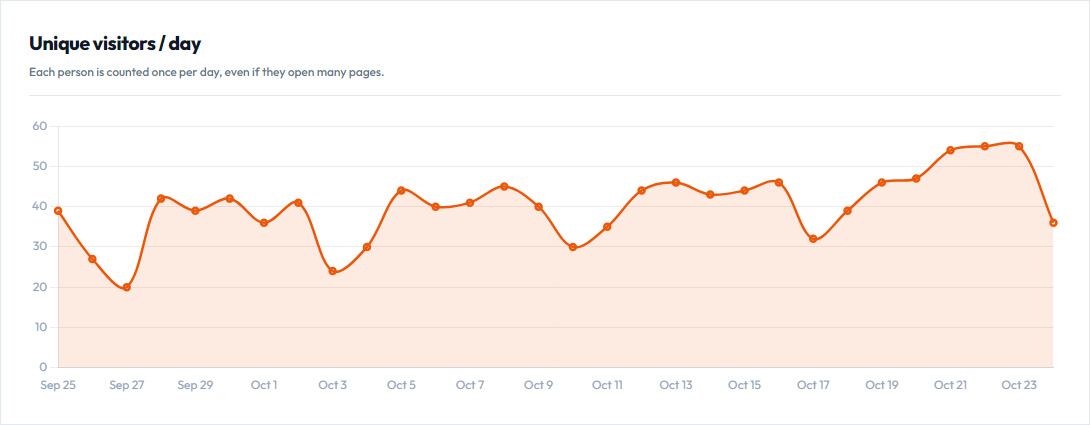
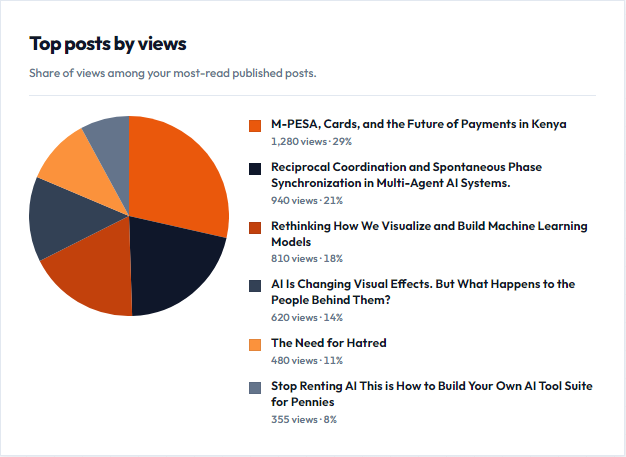
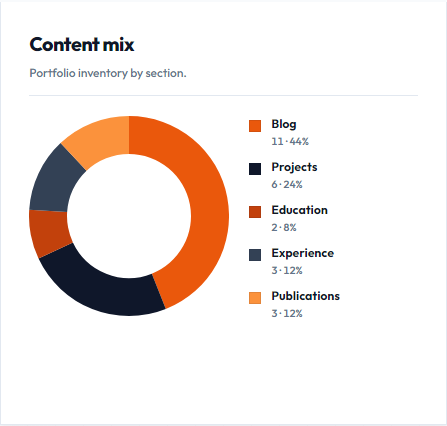
Under the map, the dashboard splits attention into charts that map to editorial decisions. Unique visitors per day tells me whether a publish day actually moved the needle. Blog readers per day counts distinct devices reading posts inside a twenty-four-hour window per post. Content mix shows whether the portfolio inventory is all blog and no publications. The top-posts pie answers which essays are absorbing the share of views — with an HTML legend so long titles wrap inside the card instead of tearing the layout.
Projects: A Glance Is Not a Launch
Blog analytics alone left a blind spot. The projects page is where demos live — Flyleaf, LyricSync, CV Studio, research tools — and many of those demos open on another host. A pageview on the portfolio is not the same as someone clicking Launch live. I needed both signals, kept separate on purpose.
When a project card scrolls into view, the page records a card view (once per visitor per project in a twenty-four-hour window). When someone clicks the mockup or the launch button, it records a live launch the same way. External demos never report their own analytics back; the outbound click is the honest proxy I can own.
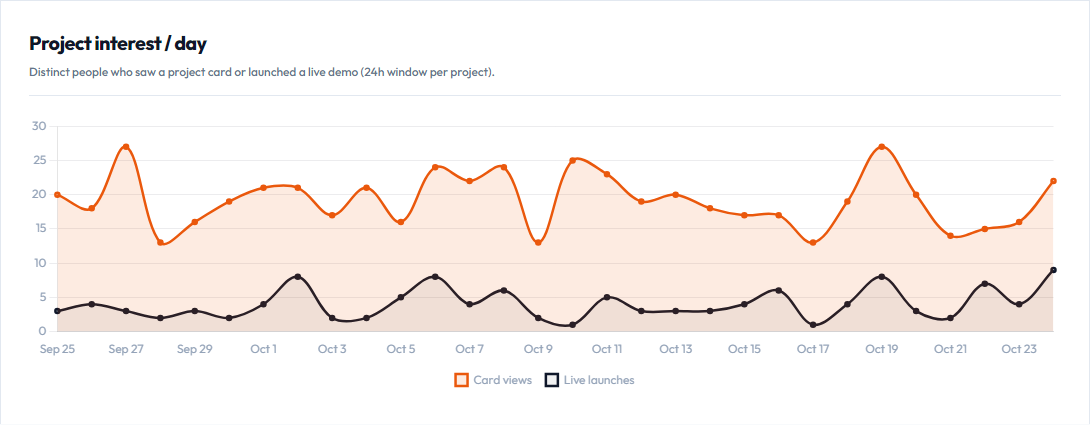
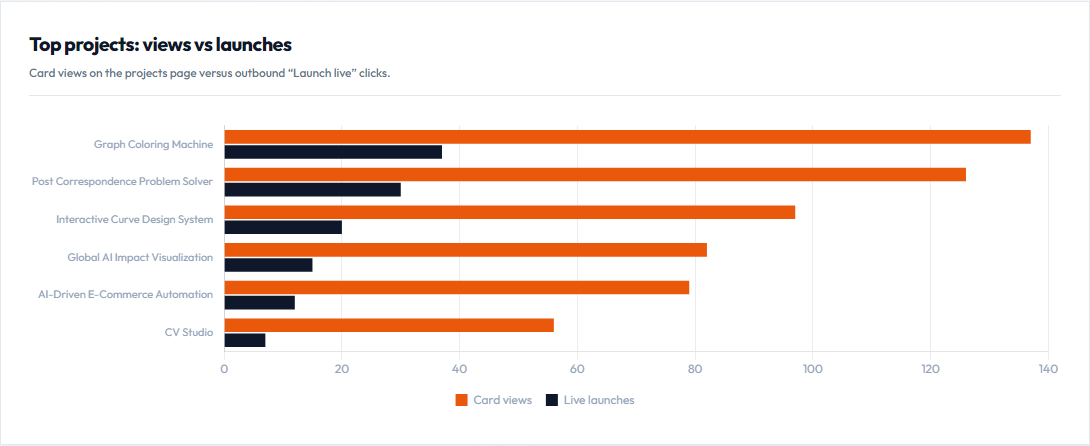
That pairing changes decisions. A project with high views and low launches may need a clearer call to action, a faster demo, or a better first screenshot. A project with fewer views but a strong launch ratio is pulling the right people. I would rather know that than stare at a single vanity counter.
"Scrolling past a project is curiosity. Clicking Launch live is intent. The cockpit keeps those as two different lines."
Lists for Work, Charts for Sense
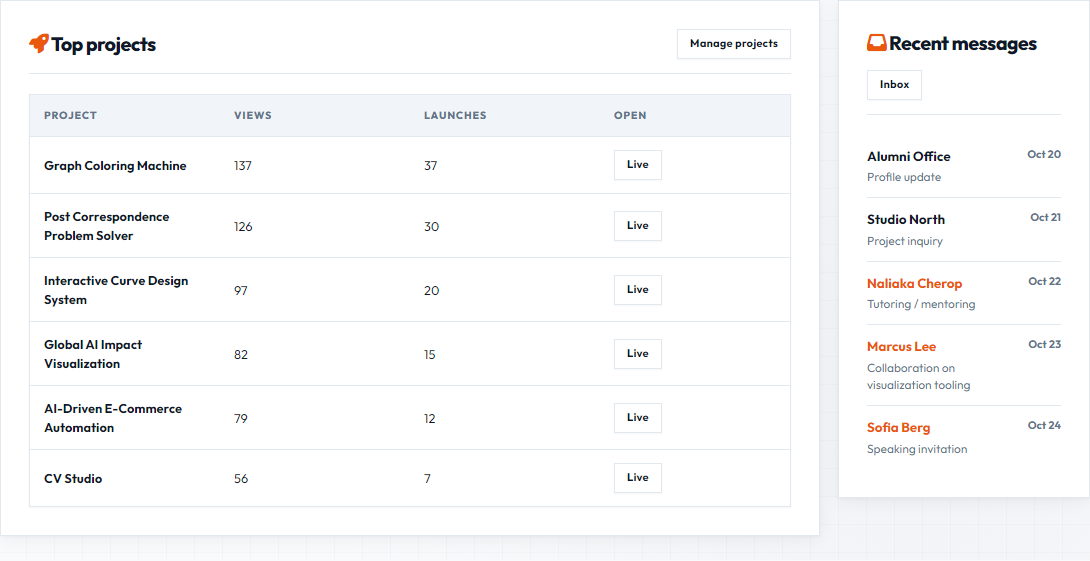
Charts tell me what is happening. Lists tell me what to do next. The bottom work row is deliberately two panels wide: top projects with views and launches on one side, recent messages on the other. I removed a third “top posts” table from that row because the pie chart already carries that story. Repeating it squeezed the layout and added nothing new.
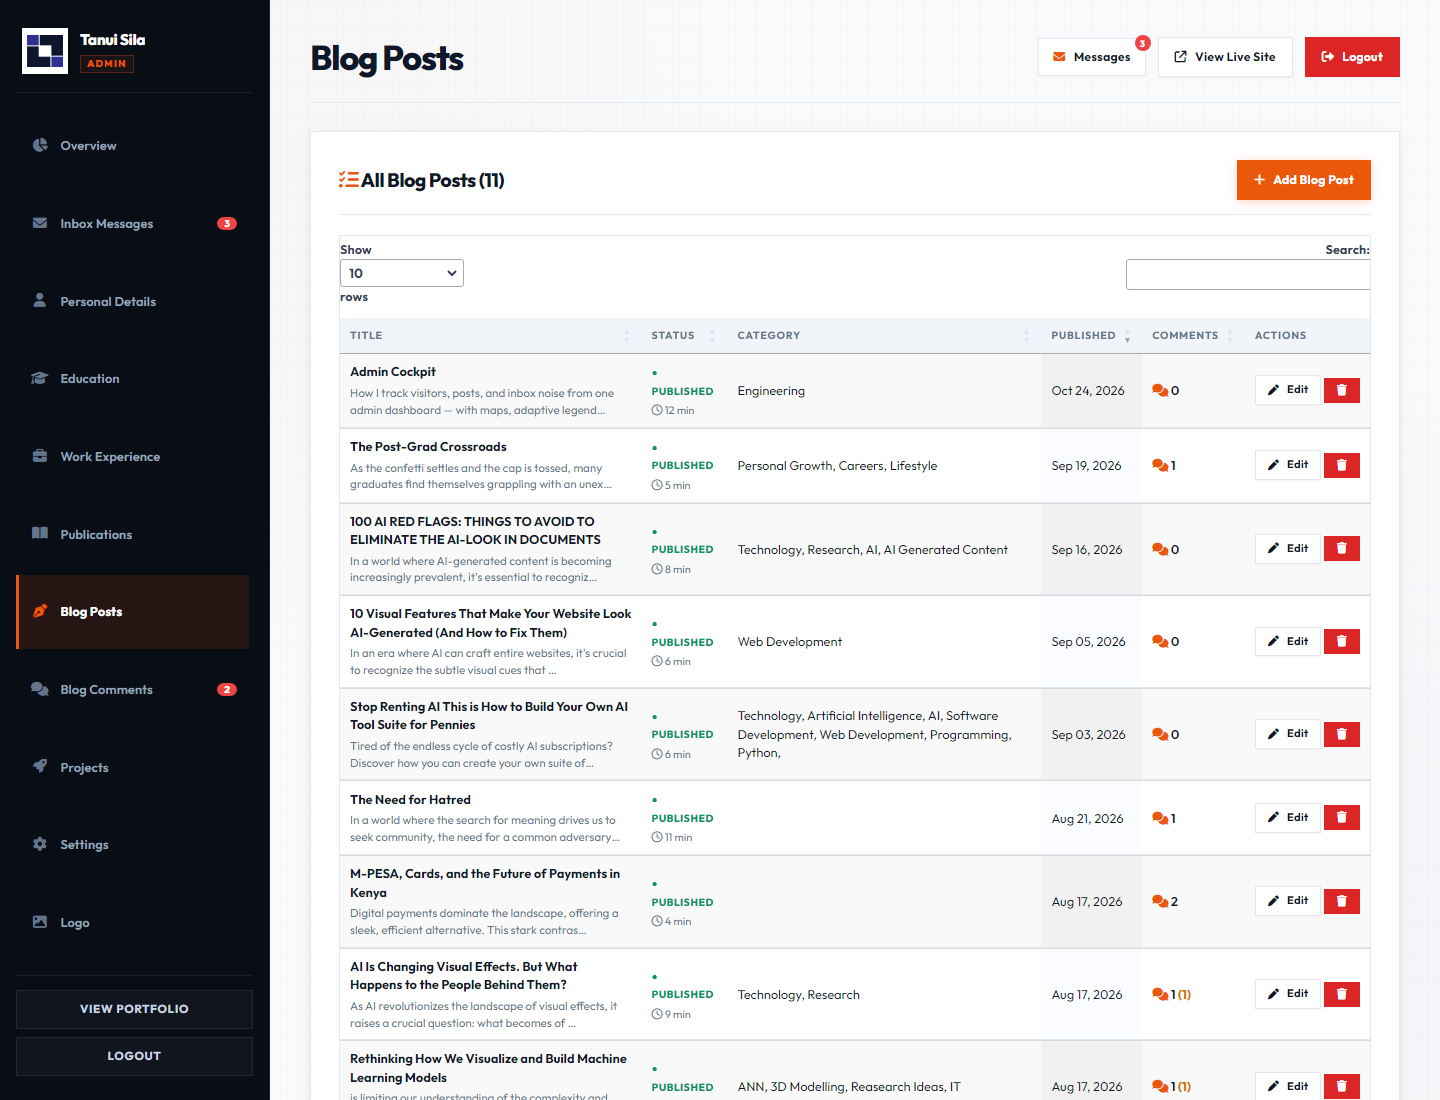
The blog admin itself stays list-first. DataTables handle search and sort. The add form collapses until I need it. I want the operating view to be the table of posts, statuses, and views, not a blank form demanding a title every time I open the page.
What a Morning Pass Looks Like
- Open the dashboard and read the KPI strip. If unread mail or pending comments are non-zero, those win.
- Scan the country map. A new pin or a sudden dark country is a prompt to ask what content might have travelled.
- Check unique visitors and blog readers for the last few days. A publish day should leave a mark.
- Read project interest: are launches tracking with views, or is a popular card failing to convert?
- Look at the top-posts pie. If one essay dominates, decide whether to write a sibling piece or leave it alone.
- Only then open the blog or projects admin to draft, edit, or ship.
That order keeps me from polishing a draft while three comments wait for approval. Ops first, craft second.
How the Stack Stays Small
The public site and admin share one PHP and MySQL codebase on ordinary hosting. Visitor rows live in site_daily_visitors with a unique key on visit date and visitor hash. Country fields are filled from Cloudflare headers when present, otherwise from a lightweight IP lookup. Blog views accumulate on the post row for the pie, while a separate view log powers the readers-per-day chart. Project card views and launches land in project_events, with counters on the projects row for the bar chart and table. A small beacon endpoint accepts those events from the projects page via sendBeacon or fetch. The dashboard charts use Chart.js. The map uses jsVectorMap with markers for tiny territories and exact fill colors so the legend never invents a shade the map did not earn.
None of that requires a data warehouse. It requires clear tables, a few honest aggregates, and UI restraint — including the willingness to delete a panel that only repeats another chart.
How You Can Build a Cockpit Like This
If you want an ops layer on your own portfolio, borrow the questions before you borrow the libraries.
- Write the questions first. Unique people, place, posts, projects, inventory, and human work. If a widget does not answer one of those, cut it.
- Decide uniqueness in one sentence. Mine is “IP plus browser family, once per day.” Publish that sentence near the chart so future-you does not reinterpret the number.
- Separate curiosity from intent on projects. A scroll-into-view is not a launch. Track both, chart both, and let the gap teach you.
- Prefer squared legends over pretty gradients. Gradients hide the top shade. Discrete chips that rebuild from the current max stay truthful when traffic is 3 or 30,000.
- Pin what the outline cannot show. Tiny territories and missing paths need markers. A list beside the map is the accessibility layer for geography.
- Keep chart legends in HTML when labels are long. Canvas legends will truncate or overflow. Post titles deserve a column that can wrap.
- Do not repeat a chart as a squeezed table. If the pie already shows top posts, the bottom row can carry projects and inbox instead.
- Stay on the host you already have. PHP, MySQL, Chart.js, and a vector map are enough. The craft is in the definitions, not in the vendor logo.
What I Left Out on Purpose
There is no real-time websocket firehose. There is no claim that IP geolocation is precise to a neighbourhood. There is no growth hacking panel promising conversion funnels on a personal essay site. External project demos are not instrumented end-to-end; the launch click is the boundary I can observe without owning their servers. I left those out because they would make the cockpit louder without making my decisions better.
I also left out public access to the admin itself. The screenshots are the shareable artifact. The login stays closed. A portfolio can show how it is run without handing strangers the steering wheel.
Admin Cockpit is the ops layer of this portfolio by Tanui Kipngetich Sila. It will not write the next essay or ship the next demo for me. It will tell me, quickly and without drama, whether yesterday’s work found people, which projects they launched, where they roughly were, and which human replies still need my name on them.
Building your own ops layer? Start with clear questions, one uniqueness rule, separate curiosity from intent on projects, and a legend that cannot hide the darkest shade. Then add only the charts that change what you publish or ship next.
Leave a comment
Email stays private. Name and email are optional.